Contact center managers are constantly asked to prove the value of their tools, justify training investments, and keep knowledge accurate, all while staying compliant and keeping agents engaged. The challenge isn't having data. It's having the right data, in the right format, at the right time.
That's exactly what the Procedureflow Insights Dashboard is built to solve.
Rolled out in phases throughout 2025 and into 2026, the Insights Dashboard introduces interactive data visualizations that transform raw activity data into clear, actionable intelligence. Whether you're tracking process adoption, coaching underperforming agents, or managing governance requirements, Insights gives you everything you need in one centralized hub.
This post walks through the current Insights reports: Flow Activity, Member Activity, and Change Activity, and explains how each one helps your team make smarter, faster decisions.
Why Reporting Has Always Been a Pain Point in Contact Centers
Before Insights, Procedureflow users had limited visibility into how their process content was actually being used. Managers couldn't easily answer questions like:
-
Are agents actually using the process flows I built?
-
Who hasn't touched a critical process in the last 30 days?
-
What changed in our knowledge base last month, and did the right person approve those changes?
These aren't niche questions. They're the foundation of a well-run contact center. Without answers, managers are left guessing, and guessing costs time, money, and quality.
The Insights Dashboard changes that.
What Is the Procedureflow Insights Dashboard?
The Insights Dashboard is a centralized reporting hub available to all users with Reporter-level permissions or above. It provides interactive visualizations that make it easy to filter, compare, and act on data. For deeper analysis, spreadsheet exports are also available.
The dashboard is available on all Procedureflow pricing plans and is built to scale with your organization's needs. It currently includes three reports:
-
Flow Activity - track how often your process content is being used
-
Member Activity - understand who is engaging with what, when, and how often
-
Change Activity - monitor updates to your knowledge base and stay audit-ready
Let's break each one down.
Flow Activity: Measure Process Adoption
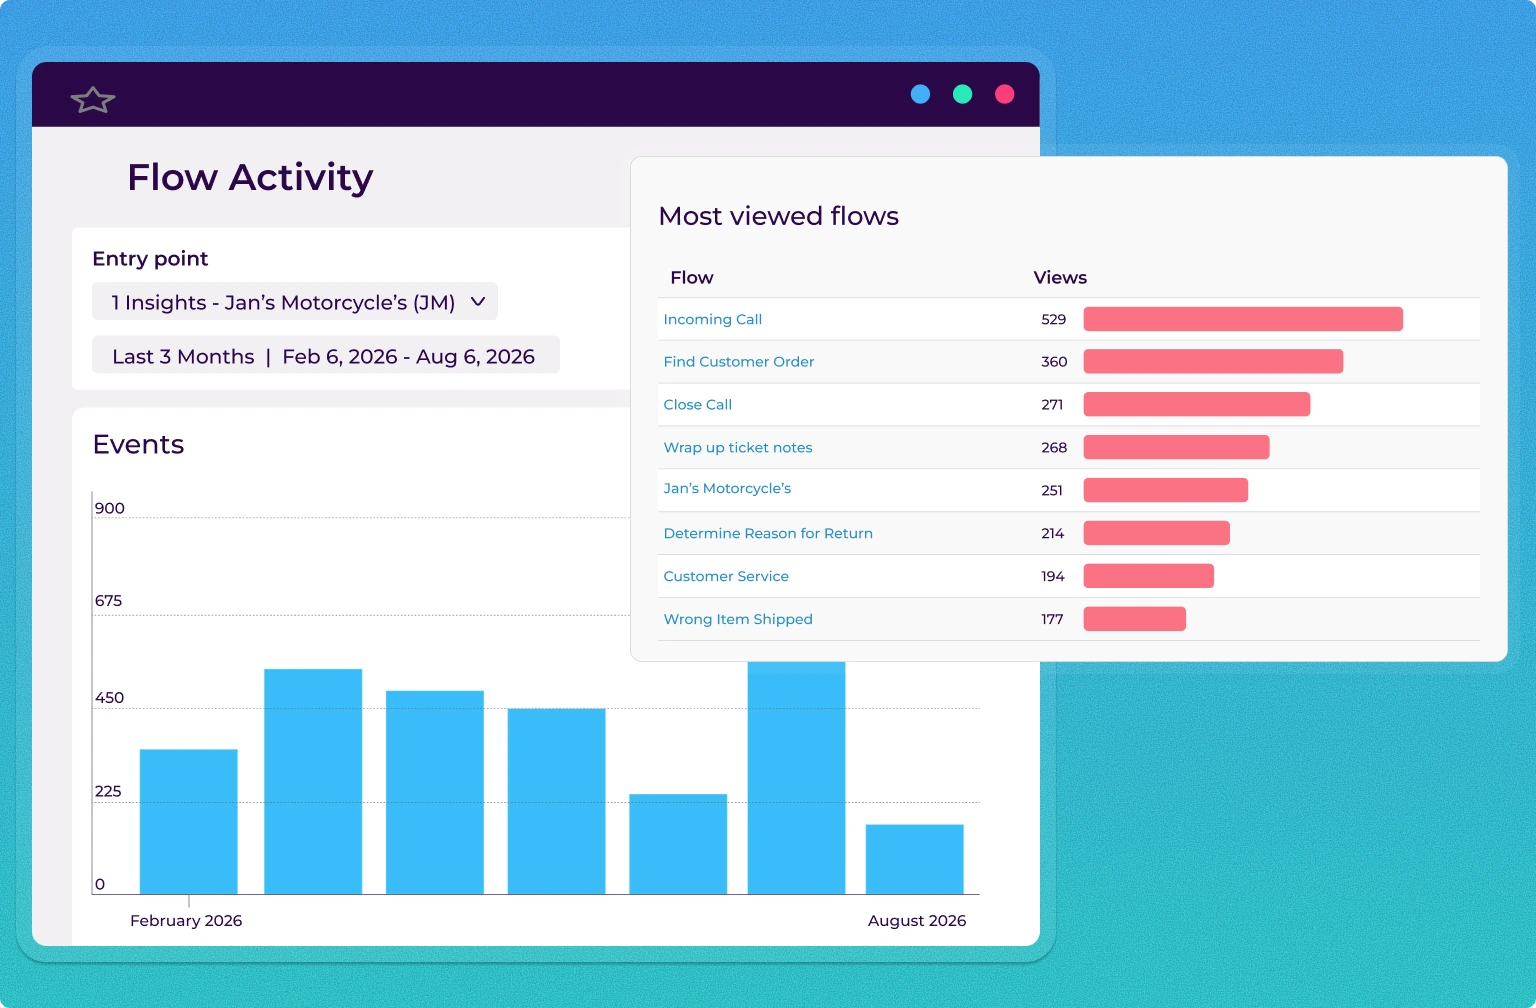
The Flow Activity Report answers the most fundamental question in process management: Is anyone actually using this process?
It tracks how often users clicked flows within a selected entry point over a chosen time range. By default, the graph displays total clicks across all flows in an entry point, giving managers a high-level picture of engagement trends. You can then filter down to a specific flow to see exactly how often it was accessed during a given period.
Key use cases for Flow Activity
Validating campaign and training impact. If your team launched a new billing campaign and you expect agent call volumes to reflect that, you can filter to the related flow and check whether clicks increased after launch. A correlation between campaign activity and flow usage is strong evidence that your process content is working.
Identifying knowledge gaps. A sudden drop -in flow activity can signal that content has become outdated, is hard to find, or has been replaced by something else. Catching those dips early means you can investigate and course-correct before they impact performance.
Measuring ROI on Procedureflow. For directors and VPs who need to justify their investment, Flow Activity provides a clear, visual record of how often teams are relying on process content to do their jobs. That's a measurable business outcome.
Data is shown over time, with users able to choose between daily or monthly intervals. Up to one year of data can be viewed at a time, though more historical data is available beyond that window
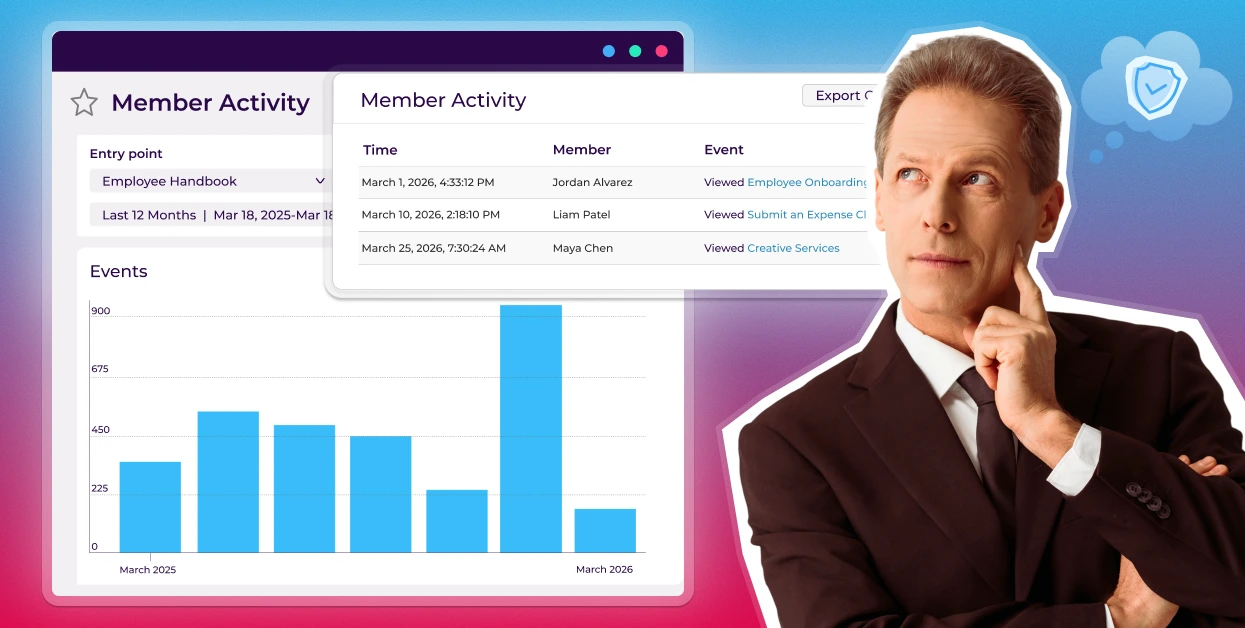
Member Activity: Know Who Is (and Isn't) Engaging
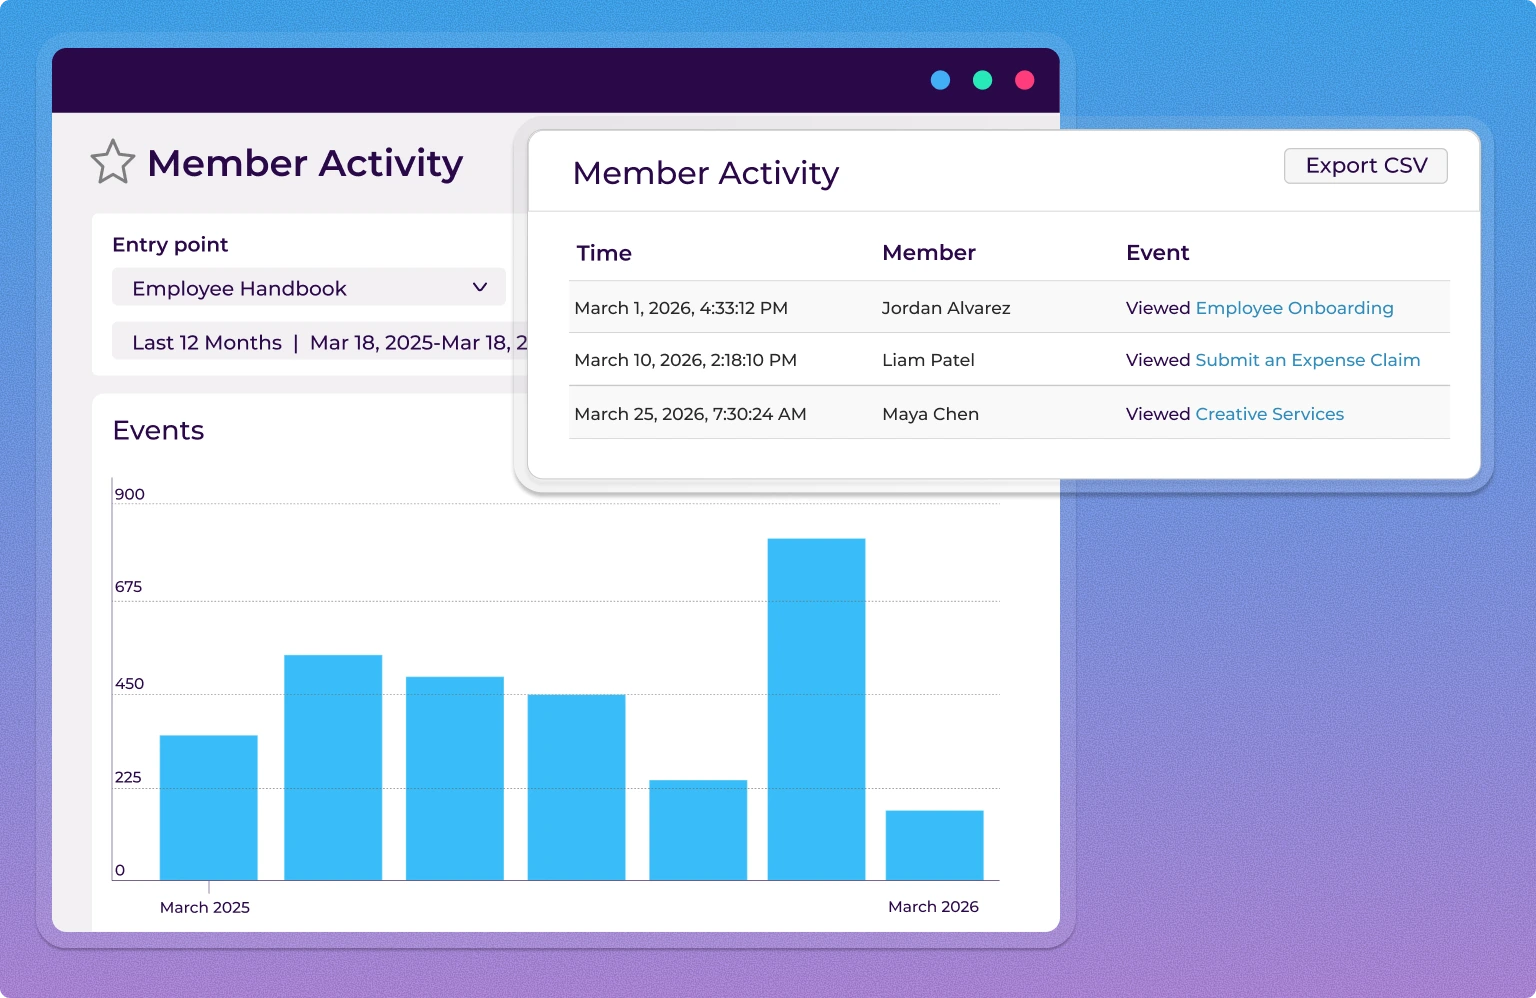
The Member Activity Report takes Flow Activity one level deeper, from what is being used to who is using it.
Who is doing what, when, within a given entry point?
Rather than sifting through page after page of logs or reviewing agents one by one, Member Activity surfaces engagement patterns at a glance. You can see which team members are consistently engaging with process content, which are underusing critical flows, and how activity trends over time.
What you can do with Member Activity data
Better coaching and onboarding. When you can see which agents haven't been active in weeks, you can target coaching before performance slips. New hires who are slow to engage can be identified early and supported with the right training. For deeper investigation into specific content, the Member Activity log can be exported and filtered outside the platform.
Surface top performers. The report doesn't just flag problems, it highlights champions. Identifying your most engaged users lets you model best practices across the team and recognize the people driving adoption.
CSV Export for deeper analysis. Have a specific question about agent engagement? Export up to 100,000 rows of Member Activity data and slice it however your team needs in Excel, your BI tool, or a custom report.
Change Activity: Governance, Compliance, and Accountability in One View
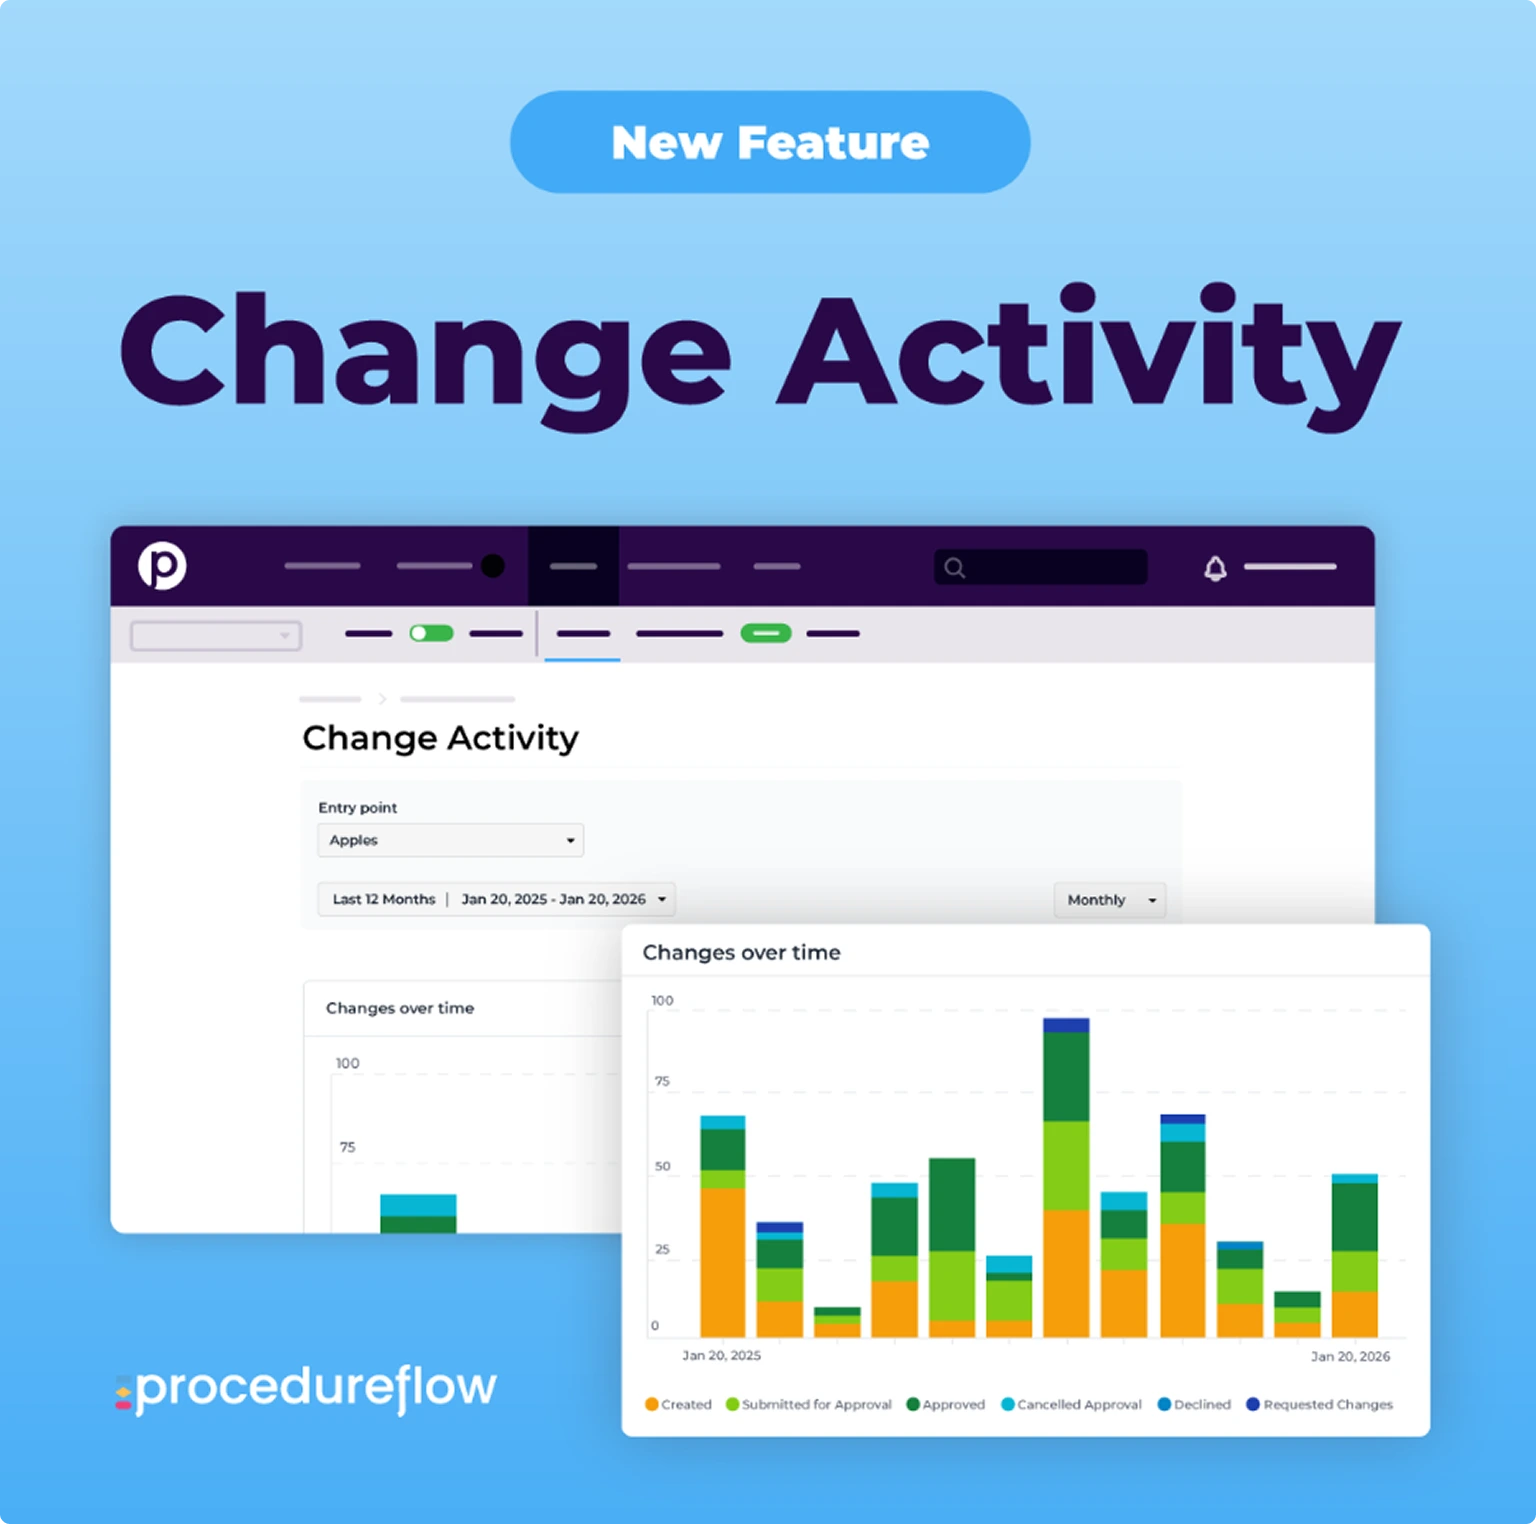
The Change Activity Report addresses a challenge that grows more important as organizations scale: knowing what changed in your knowledge base, when it changed, and who was responsible.
Without this visibility, contact centers face real operational risks, including outdated flows in circulation, unauthorized edits, and manual audit processes that are slow and error prone.These risks can be minimized with automated, real-time tracking.
Change Activity provides a stacked bar graph that shows change events over time, giving managers a high-level view of how much activity is happening in their knowledge base. It's easy to spot spikes, quiet periods, or patterns that warrant further investigation, with flexible date filtering and the ability to drill into specific timeframes.
Change Requests Leaderboard. See who is submitting change requests, along with their associated approval rates. This encourages participation, recognizes top contributors, and helps managers ensure that the right people are involved in knowledge updates.
Change Activity Log. A time-stamped, auditable record of every change, including what was updated, when it happened, and who was involved. For organizations with compliance requirements, this is a critical capability that eliminates manual tracking and keeps teams audit-ready at all times.
How the Three Reports Work Together
The real power of the Insights Dashboard isn't in any single report. It's in how Flow Activity, Member Activity, and Change Activity combine to give you a complete picture of your knowledge management ecosystem.
Here's how a typical workflow might look:
-
Flow Activity shows a dip in engagement with a key process flow starting in February.
-
Change Activity reveals that the flow was updated three times in January, possibly introducing confusion or errors.
-
Member Activity identifies which specific agents have disengaged, pointing toward targeted coaching conversations. For deeper investigation, this data can be explored further via spreadsheet export.
That kind of connected insight, moving from trend to cause to action, is what separates reactive management from proactive leadership.
Getting Started with Procedureflow Insights
The Insights Dashboard is available to all Procedureflow users with Reporter-level permissions or above. Core insights are available on every pricing plan, with additional insights available on select plans. No additional setup is required. Simply navigate to the Insights tab in your Procedureflow account to get started.
This dashboard brings your team's reporting into one place, with new insights added as the product evolves.
The Insights Dashboard represents a fundamental shift in how contact center leaders interact with Procedureflow, from a tool agents use to a platform that drives organizational intelligence. If your team has ever struggled to prove adoption, identify coaching needs, or stay on top of knowledge governance, Insights is built for you.
Explore Procedureflow's full feature set and see how Insights fits into a broader strategy for contact center excellence.